Brand Categories
- +Multilingual PDF Manuals
- +New PDF Manuals
- AGCO
- Allison
- AMMANN
- Atlas Copco
- BELL
- Bendix
- BOBCAT
- Bomag
- Case
- Caterpillar
- CLAAS
- CLARK
- CNH
- CROWN
- Cummins
- DENSO
- Detroit
- DIECI
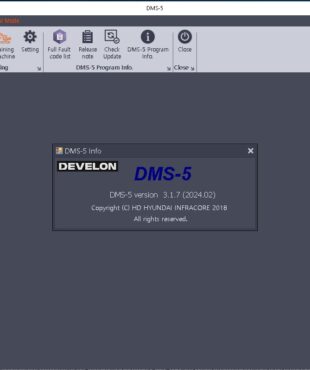
- Doosan
- DYNAPAC
- EATON
- FENDT
- FIATALLIS
- FULL LAPTOP
- Furukawa
- GEHL
- GROVE
- Hino
- Hitachi
- Hyster
- Hyundai
- INTERNATIONAL
- Isuzu
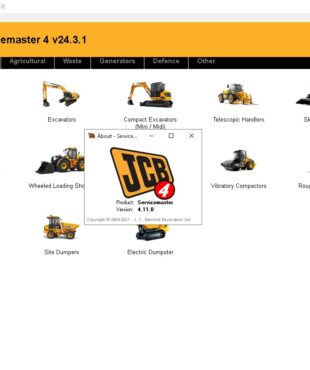
- JCB
- JLG
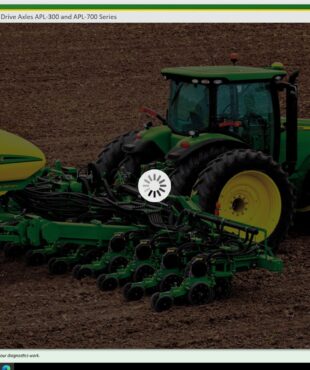
- John Deere
- JPRO
- Kawasaki
- Kobelco
- KOHLER
- Komatsu
- Kubota
- Liebherr
- Liebherr Crane
- Linde
- Link Belt
- LIUGONG
- Man
- Manitou
- Manitowoc
- Massey Ferguson
- Mercedes
- MERLO
- MITSUBISHI
- MTU
- MUSTANG
- Navistar
- NEW HOLLAND
- Paccar
- Perkins
- Raymond
- Renault
- SANDVIK-TAMROCK
- SANY
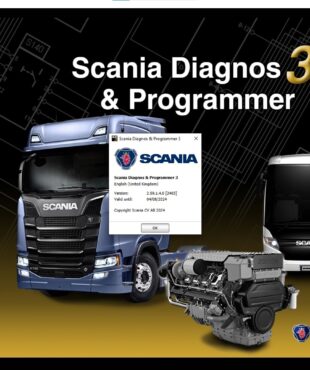
- Scania
- SENNEBOGEN
- Shibaura
- Still
- Sumitomo
- Tadano
- TAKEUCHI
- TCM
- Terex
- Tigercat
- Toyota
- VALTRA
- Volvo
- Volvo PDF Manual
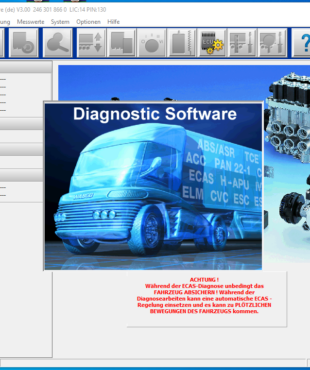
- WABCO
- WACKER NEUSON
- Wirtgen
- YALE
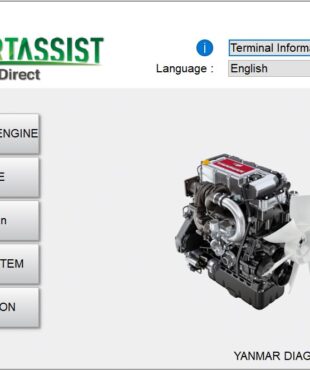
- Yanmar
- ZF